We can get frustrated with spreadsheets because they don’t do what we want them to do, or we just think that they are used by statisticians. With more data around than ever before, especially in schools, it can be hard to use the data well. Here are three simple tips for working with data in Google Sheets that allow you to be able to analyse and display your data like an expert.
[bctt tweet=”Three simple tips for working with data in Google Sheets that allow you to be able to analyse and display your data like an expert.!” username=”adifrancis”]
1.Automatically suggested formulas
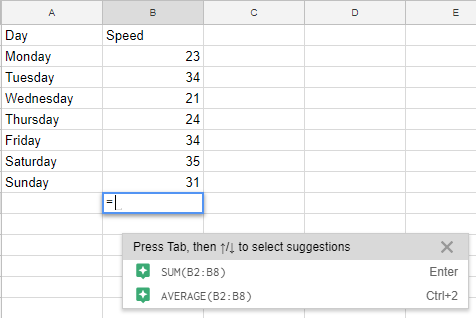
This feature will automatically suggest simple formulas to use based on the data you have entered when you hit the ‘=’ key. Currently the only functions that appear are sum and average, which are used frequently by students when they are measuring data. Watch this short video to see how to use this feature.

2.Creating and embedding charts
It is easier to ‘see’ what is going when data is presented graphically. Just highlighting the data and selecting Insert -> Chart will put a chart on the sheet. It is possible to change the chart type and customise it by using the chart editor. Watch this 2 minute video to see how to create and edit a chart.
Often we use data in a presentation or write up. In a classroom, it may be data collected via a form that the whole class contributes to, and as a teacher you want students to complete an individual write up. This can be done by linking or embedding the chart in a Doc or Slide. The great thing is that it will update in the Doc or Slide as the data changes. This can also be turned off so that the analysis doesn’t have to be adjusted. Watch this short video (1.5 minutes) demonstrating how to do this.
3.Using Explore
This tool is just getting better all the time. Not only can it assist in helping analyse and display categorical data (which often students collect), but it will help you find answers to your data when you type in a question. This is super handy when you have a lot of data and you don’t want to spend time cleaning and isolating what you are looking for.
[bctt tweet=”The Google Sheets Explore tool is super handy when you have a lot of data and you don’t want to spend time cleaning and isolating what you are looking for.” username=”adifrancis”]
Another fantastic feature is that Explore also shows you the formula it uses to find your answers. This way you can use and adapt the formula for other sheets you may have, or if you want to impress someone with your spreadsheet ninja skills! This short 3 minute video shows how to access Explore and use some of the functions. The demonstration sheet be accessed here.
These three simple tips for working with data in Google Sheets allow you to tap into the features of Google Sheets and help you start to master the data you have.
Do you want to learn even more G Suite tips and tricks? Join our online professional learning community.


