Tag: Quick tips

How can we use digital technologies to capture evidence of student thinking?

The idea of digital integration is one that we get asked about a lot! Many teachers are unsure just how they could bring coding, robotics, digital activities or technology in general into their programmes without making it a stand-alone ‘something else’ they have to find time in their day to fit in. This blog will give you three easy ways to get started.

Don’t write your stories – create them!

Why is it that in schools, more often than not, we simply ask students to ‘write’ their story. In many cultures, their traditions and histories are passed on mainly through the rituals of oral, not written, storytelling. This blog looks at a more creative way for students to tell their story.

G Suite - Sweet As. Tips and Tricks from the UTB Team

Google Workspace – Sweet As. Tips and Tricks from the UTB Team.

Here at UTB we do loads of training in G Suite with both corporate and education clients. So often we find that it’s the ‘little things’ that get the biggest reactions from our trainees. These ‘little things’ are usually pretty basic and simple but make a huge impact as they can help to increase your efficiency with tasks that you do everyday.

Pre-filled links in Google Forms – make sorting and filtering a breeze!

Google Forms are an awesome tool for gathering information from groups of people. One issue with Google Forms can be the way that users enter information – a slight difference in punctuation or spelling will mean that your ability to sort and filter the results in Google Sheets can be impacted. This blog will show you how to use a ‘Pre-filled link’ to stop this.

Encourage Students to use spare time purposefully

As learning becomes more self directed and students work collaboratively more often, we tend to have times when some have finished and some haven’t. Rather than letting those finished have ‘free time’ how about designing some form of a choice board with purposeful, engaging activities that develop 21st century Skills.
Here are four ideas you could include.

5 ways to develop creative STEAM projects.

It is possible to deliver a STEAM project to students which kills creativity. Without significant and purposeful learning design STEAM learning can inhibit the very things we are trying to support students to develop. Here are five tidbits of thought to help you think critically about STEAM and creativity.

Reflective teaching using the time-lapse feature on iPad

It would be great if we could observe our own classes from a distance and then analyse what is going on and reflect, identify areas of strength and growth. By using the time lapse feature on an iPad (or on iPhone) you can easily reflect on your teaching practice.

Using Named Ranges in Google Sheets

Using named ranges in Google Sheets will stop cell references being messed up inside formulas when you copy or move cells. They also help you become more efficient in creating great, functional spreadsheets.

How to make a single Google Doc available offline

Many of us are now working with a G Suite account as our primary source of a digital word processing tool. Some of us are using it as our secondary source – but whichever way we are doing it, there are times when we just may want to access it offline. Here’s a way to do it with just a few minutes of forward planning.

How to encourage student agency with hyperdocs.

We are often asked how teachers can encourage student agency using digital tools. Here’s an example of one way you can build a task that allows for student choice and differentiation within the activities provided.

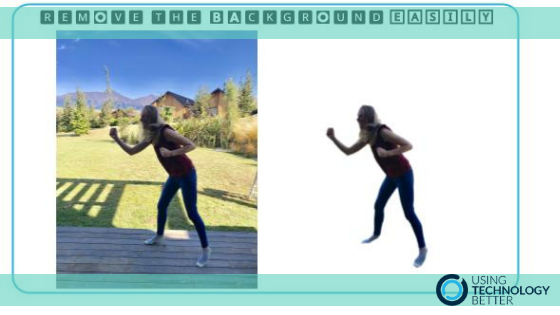
How to easily remove the background of a photo

A question we often get asked is how can the background of a photo be removed to create a png image.
Until recently the answer involved a few steps and sometimes quite a bit of fiddling around. Now – if you are connected to the internet – the answer has become a whole lot easier.

Watch the video below to see how simple the process can now be.

How to Create Line of Best Fit & Scatterplots in Google Sheets

Collecting data and finding the strength of the relationship between the variables, a method used in statistics. Making a scatterplot and finding the line of best fit or trendline in Excel was a piece of cake. I could never do it in Google Sheets until I found a solution! It is easy to build a meaningful scatterplot, put in a trendline and find the correlation coefficient within a couple of clicks.

What Industry Are You In?